



Non-metallic mineral beneficiation is more nuanced than just extracting target minerals. With fluorspar, graphite, and quartz, success hinges on understanding product specifications, customer needs, and process economics—not just recovery rates.
For non-metallic minerals like fluorspar, graphite, and quartz, beneficiation success depends on balancing recovery rate, product quality, and cost efficiency. High recovery alone doesn’t guarantee profitability—product specifications (e.g., CaF₂ purity in fluorspar, carbon content in graphite, SiO₂ grade in quartz) and market demand dictate value. Always start by defining the end product before designing the process flow.
While these minerals share similarities in being non-metallic, their beneficiation challenges vary widely. Let’s break down each one to uncover why a “one-size-fits-all” approach fails.
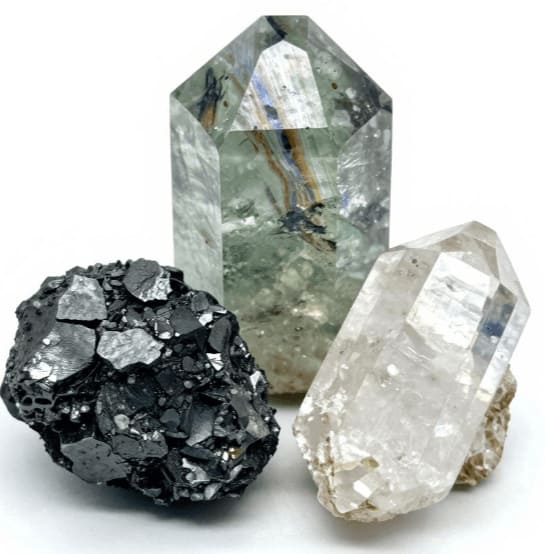
What Exactly is Involved in Non-metallic Mineral Beneficiation?
Non-metallic beneficiation isn’t about brute-force extraction. It’s a puzzle where ore properties, product specs, and economics intersect—often unpredictably.
Non-metallic beneficiation focuses on meeting strict product standards (e.g., low impurities, particle size) rather than maximizing recovery. Unlike metals, where recovery dominates profitability, here even 90% recovery can be worthless if the product doesn’t meet market requirements. Key steps include ore characterization, process mineralogy, and iterative testing to align with customer needs.
Core Differences from Metallic Beneficiation
Product Over Recovery:
- Metals: Value scales with recovery (e.g., 95% gold = 95% revenue).
- Non-metals: A 95% SiO₂ quartz may sell for $50/ton; 99.5% SiO₂ fetches $500/ton.
Impurity Tolerance:
- Fluorspar: Just 1% silica can disqualify it for acid-grade use.
- Graphite: Ash content determines battery suitability.
Process Flexibility:
- Metals: Standardized flows (flotation, leaching).
- Non-metals: Customized steps (e.g., graphite requires multiple grinding-flotation cycles).
Table: Key Benchmarks
| Mineral | Critical Metric | Market Demand Driver |
| Fluorspar | CaF₂ ≥ 97% | Chemical industry purity |
| Grafit | Carbon ≥ 95% | Battery anode performance |
| Kuarsa | SiO₂ ≥ 99.5% | Semiconductor cleanliness |
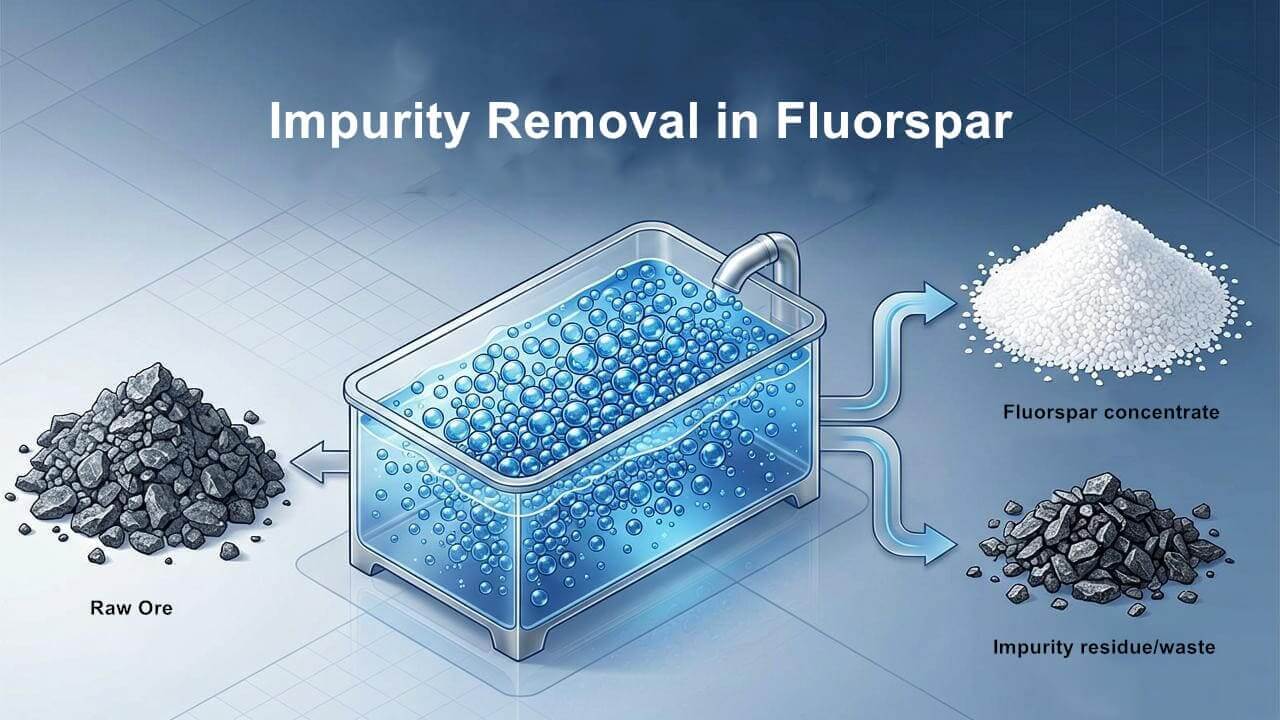
Fluorspar Beneficiation: Is Simply Floating Out The CaF₂ Enough?
Floating 90% CaF₂ sounds great—until you realize the product sells at half the price due to iron contamination.
Fluorspar beneficiation requires achieving acid-grade purity (≥97% CaF₂) with strict limits on silica, carbonates, and heavy metals. Simple flotation may recover CaF₂ but fail to remove impurities. Multi-stage processing (e.g., reverse flotation, acid leaching) is often needed to meet specs.
Why Purity Beats Recovery?
Acid-Grade Fluorspar:
- Used in HF production; tolerates <1% SiO₂.
- A 90% recovery with 96% CaF₂ loses to 70% recovery at 97.5% CaF₂ in revenue.
Common Pitfalls:
- Overgrinding: Liberates silica, increasing impurities.
- Ignoring carbonates: They consume HF during end use, reducing product value.
Case Study: A Mexican mine upgraded fluorspar from 92% to 97.5% CaF₂ by adding a leaching step, doubling profits despite a 15% lower recovery.
Manfaat Grafit: Does a High Recovery Rate Equate to a High-quality Product?
Graphite with 85% recovery but 8% ash content is useless for EVs—despite what the recovery numbers suggest.
Graphite quality hinges on carbon content (≥95% for batteries) and particle shape. High recovery means little if the product has high ash or wrong morphology. Multi-stage grinding, flotation, and thermal purification are often required.
The Battery-Quality Conundrum
Ash Content:
- <5% ash is critical for lithium-ion anodes. Achieved via:
- Alkali roasting (removes silicate impurities).
- Column flotation (reduces micron-scale contaminants).
Morphology Matters:
- Spherical graphite (20µm) commands premium pricing.
- Requires tailored grinding to avoid flattening flakes.
Table: Graphite Grades
| Kelas | Carbon % | Use Case | Price/Ton |
| Flake | 90-93% | Refractories | $700 |
| Baterai | 95-99% | EVs | $1,200 |
| Amorphous | 80-85% | Pencils, lubricants | $400 |
Quartz Beneficiation: Is The Recovery Rate The True Determinant of Value?
Quartz at 98% recovery but 99% SiO₂ misses the semiconductor market—where 99.99% purity is the baseline.
Quartz value scales exponentially with purity. While 90% recovery of 99% SiO₂ quartz may yield $30/ton, 50% recovery of 99.99% SiO₂ fetches $5,000/ton. Processing involves acid leaching, magnetic separation, and ultra-fine flotation to remove trace elements like iron and aluminum.
The High-Purity Calculus
Impurity Limits:
- Semiconductor quartz: <50 ppm total impurities.
- Achieved via:
- Attrition scrubbing (removes surface contaminants).
- HCl leaching (dissolves iron coatings).
Cost Trade-Offs:
- Solar-grade (99.99% SiO₂) justifies higher processing costs.
- Glass-grade (99.5%) prioritizes volume over purity.
Real-World Example: A Brazilian quartz project rejected a 90% recovery flow sheet because the product couldn’t crack the high-purity market. They optimized for 60% recovery but 99.99% purity—tripling revenue.
Fluorspar vs Grafit vs Kuarsa
| Mineral Type | Key Indicators to Watch |
| Fluorit | CaF₂ content, recovery rate, gangue impurities, product specifications |
| Grafit | Fixed carbon content, recovery rate, flake preservation, product particle size |
| Kuarsa | SiO₂ purity, impurity content, particle size and product requirements |
You will find that the beneficiation methods for these three minerals differ, yet they share a crucial commonality: their ultimate value is not determined solely by the “recovery rate.” This highlights a significant difference in strategic approach between non-metallic mineral projects and many metallic mineral projects.
How Should The Process Flow be Designed For Non-metallic Minerals?
Designing a process flow for non-metallic minerals requires backward thinking—start with the end product, not copy-paste someone else’s process.
For non-metallic minerals, the process flow must be designed in reverse: First define the product specs (e.g., purity, particle size), then analyze customer needs, study ore properties, and finally select technologies. Blindly copying existing flowsheets often leads to unmarketable products, even with high recovery rates.
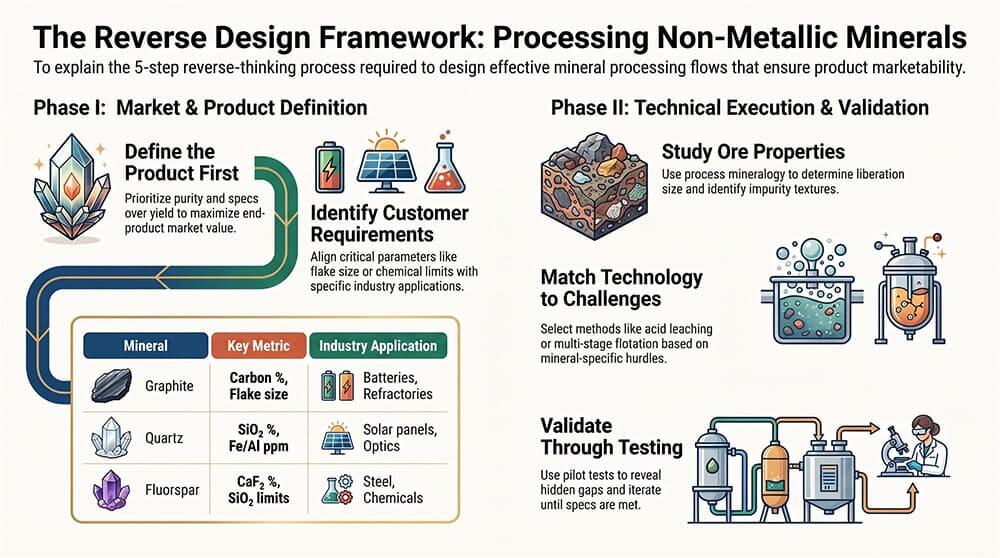
The 5-Step Reverse Design Framework
Step 1: Define the Product First
Industrial vs. High-Spec:
- Example: Quartz for glass (99.5% SiO₂) vs. semiconductors (99.99% SiO₂).
- Trade-off: Higher purity = lower yield but exponentially higher value.
Step 2: Identify Customer Requirements
Critical parameters vary by mineral and use case:
| Mineral | Key Metrics | Industry Application |
| Fluorspar | CaF₂ %, SiO₂ limits | Steel, chemicals |
| Grafit | Carbon %, flake size, ash content | Batteries, refractories |
| Kuarsa | SiO₂ %, Fe/Al ppm | Solar panels, optics |
Step 3: Study Ore Properties
Use process mineralogy to answer:
- Liberation size: How fine must you grind? (e.g., graphite flakes >100µm for batteries).
- Gangue minerals: Are impurities soluble (carbonates) or refractory (clays)?
- Textures: Are valuables encapsulated (e.g., silica coating quartz)?
Step 4: Select Technologies
Match methods to challenges:
- Grafit: Multi-stage flotation + thermal purification for battery-grade.
- Kuarsa: Attrition scrubbing + acid leaching for 99.99% SiO₂.
- Fluorspar: Reverse flotation to depress silica in acid-grade production.
Step 5: Validate Through Testing
- Pilot tests reveal hidden gaps (e.g., overgrinding graphite destroys flakes).
- Iterate until product meets specs—even if recovery drops.
Pitfall Alert: A Mongolian fluorspar project failed by copying a “proven” process; their ore had different carbonate types, requiring a redesigned flow.
Kesimpulan
Non-metallic mineral beneficiation (fluorspar, graphite, quartz) demands a market-first approach. Recovery rates matter less than meeting exact product specifications—whether it’s 97% CaF₂ for acid-grade fluorspar, 95% carbon for battery graphite, or 99.99% SiO₂ for semiconductor quartz. Always start by defining the end-user’s needs, then design the process backward. Blindly chasing high recovery can render even high-grade ore unprofitable.
PRODUK TERBARU
-

Inclined Vibrating Screen
The inclined vibrating screen is a simple and eff…
-
High Temperature & Pressure Gold Desorption Electrolysis System
High-Temperature & Pressure Gold Desorption Elect…
-
Normal Temperature & Pressure Gold Desorption Electrolysis System
The normal temperature & pressure gold desorption…


BERITA TERBARU
- Modern Cyanide Residue Treatment Technologies for Gold Processing
- Traditional De-cyanidation Technologies for Gold Cyanide Residues
- Shaking Table, 3-Disc Dry Magnetic & Electrostatic Separator for W-Sn-Ta-Nb
- Mineral Analysis: The Foundation for Successful Mineral Processing Projects
- What Is Over-Grinding and How Can It Be Prevented?
 English
  French
  Spanish
  Portuguese
  Indonesian